There exist promising methods that allow us to generate detailed hypotheses from rich exploratory data. ‘Sequence analysis’ refers to a class of methods where the unit of analysis is not a specific set of outcome measures, but the changing state of a system over time. ‘System’ in this sense refers to any set of interconnected parts which forms a complex whole – in psychology, this can be an attitude, a person, a group, a culture, or anything similar. In many cases, the mere order of events within a system is sufficient to draw conclusions about the way a system behaves and how its structural components interact (Bakeman & Gottman, 1997). Sequence analysis may be considered a specific application of the more-general dynamical approach to psychology (see e.g. Friedenberg, 2009; Nowak, 2004; Vallacher et al., 2002). Human mental processes are dynamic – “Emotions show enormous fluctuations, thoughts flow in a stream of consciousness, and both individual and group action are defined in terms of coordinated patterns of change” (Vallacher & Nowak, 1997, p.73). These changes over time do not reflect random variation but are characteristic of internal causality. The main thrust of the dynamical perspective is that the primary source of change in a dynamical system is the system itself - the best predictor of a variable’s state at one time is its state at a previous time. Thus any given variable can act as both a cause and an effect.
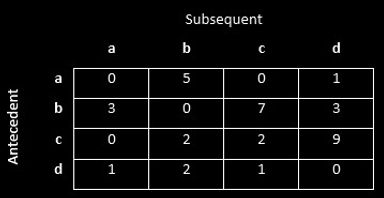
Table 3.1. Example transitional frequency matrix for a small-n sequence
set with four event codes a, b, c and d. Here the event-pair “a-b” occurs
5 times, “b-a” 3 times, and so on.
The goal of this approach is to describe the functional connections between variables in a system and how they contribute to its function as a whole. Though the complexity of social processes has often been attributed to the complexity of the system elements and their interactions (ibid.), it has been known for some time that highly complex behaviour can be generated from very simple rules in nonlinear systems (Camazine, 2003; Goldstein, 1999; Nowak, 2004). Non-linearity is the key to this emergent effect. Since the feedback process inherent in dynamical systems is not well-suited to investigation through one-directional cause-effect relations or the division between independent and dependent variables (Vallacher & Nowak, 1997), there is evidence that complex social processes such as attitude formation may be well-explained by investigating their temporal structure using dynamical methods, rather than through the classical experimental paradigm.
Sequence analysis is one such method. By recording timelines of events for multiple participants, it is possible to estimate the transitional frequencies of given event pairs. ‘Events’ here are discrete instances of some behaviour at an arbitrary scale – a given sequence record may contain coarse-grained events (“waking up”, “leaving the house”, “going to work”) while another may use a finer grain (“having breakfast”, “brushing teeth”, “tying shoes”, “opening the door”…), so long as these are internally consistent. When these are recorded by an experimenter, a consistent coding scheme is used so that functionally-similar events are coded under the same label – where, for instance, “having coffee” and “eating toast” may both be coded as “having breakfast” if it is parsimonious to do so. Event pairs consist of an antecedent and a subsequent event, such that an event sequence coded A-B-C-D may then be described by the event pairs AB, BC, and CD. The core of sequence analytic methods is the transitional frequency matrix, where event antecedents are plotted against their consequents, and the relative frequencies of these pairs are tallied
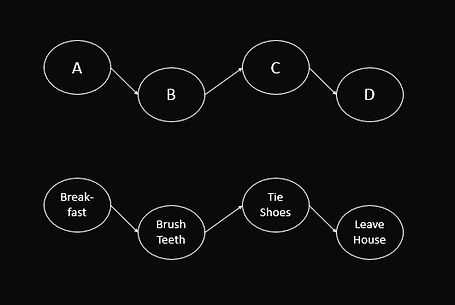
Taking the simple example provided, we may sequence the behaviours as shown in Figure 1. This 'map' is a simplified version of the State Transition Diagram (the main outcome of sequence analysis). A number of analyses and considerations must be taken into account before these diagrams are meaningfully developed and understood (See Tutorial 2: Advanced Sequence Analysis Methods [coming sooon]). Figure 1 provides an indication of the type of sequence diagrams that can be drawn from sequence analysis. Actual diagrams are usually more complex; however, still provide a simplified, comprehensive, and accessible account of real-world behaviours.
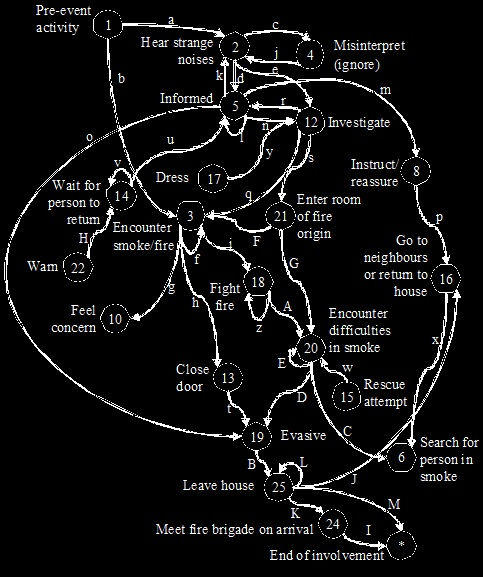
A good example is provided by Lawson (2010), who investigated the sequence of behaviours in domestic fires. The diagram involves a more complex pattern of interactions between events; however, following each pathway begins to show clear patterns emerging (See Figure 2)
An
Introduction
to
Sequence
Analysis


Figure 1: Simple State Transition Diagram


Figure 2: State Transition Diagram of Behaviours in Domestic Fires (Lawson, 2010)

